
Last week, Chicago Public Schools (CPS) unveiled the details of its latest round of budget cuts. After CPS failed to receive state funding, CEO Forrest Claypool initiated the cuts in an attempt to close a $480 million budget gap. CPS is currently operating at a $1.1 billion deficit, and administrators are facing criticism from the Chicago Teachers Union that the cuts are an attempt to force teachers into contract negotiations. As part of the cuts, CPS has announced it will no longer contribute to teacher pensions as it has done in the past, a decision that is expected to save the district $65 million this year and $130 million per year afterwards.
Individual school budgets are determined by the number of students enrolled on the twentieth day of the school year. This system, called Student Based Budgeting (SBB), also dictates the way cuts are made, as changes in student enrollment dictate the percentage of funding taken out of a given school’s budget. According to DNAinfo, schools with the highest enrollment received the steepest cuts in last week’s budget announcement.
Schools typically spend between ninety-three and ninety-nine percent of their SBB funds on teacher salaries. The remainder is spent on services and materials. Though each school’s deficit is determined by the school district, principals must decide on their own what they want to cut.
1 Schools on the North Side face the largest cuts, both in the amount of money cut and the percent change in their overall funding. North Side schools had an average of $86,440 in cuts, while schools on the South and West Sides took losses of about half that amount on average. Schools on the North Side had their budgets cut by 1.99 percent on average, while schools on the West and South Side had average cuts closer to 1.18 percent and 1.25 percent.
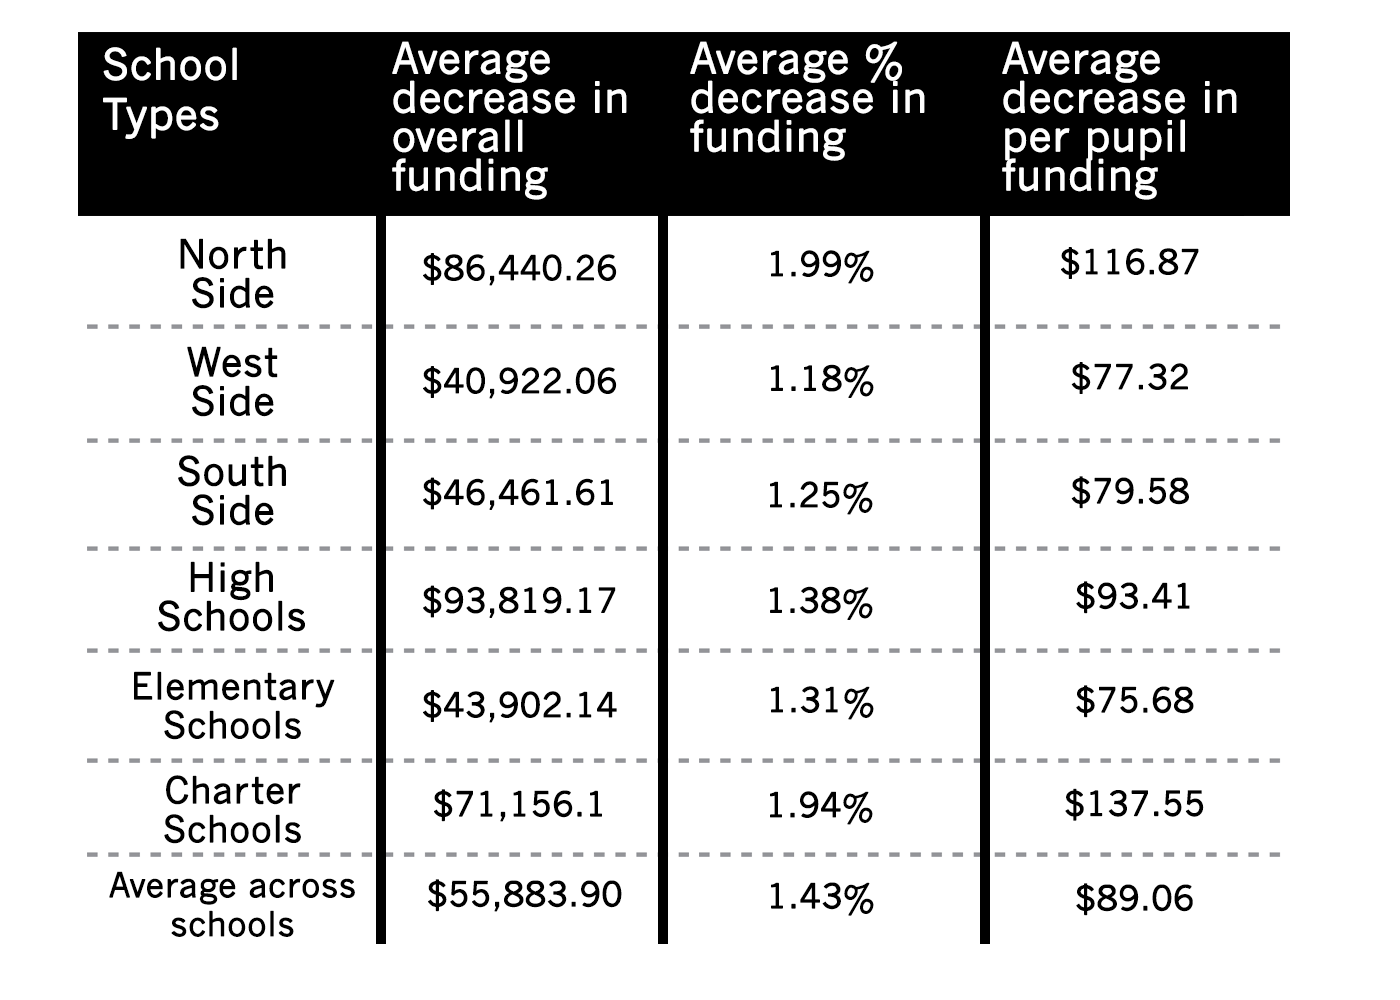
2 High schools faced the largest overall cuts, with an average cut of $93,000 compared to an average of $44,000 for elementary schools and $71,000 for charter schools. The percentage reductions differ less across school type and location, however.
3 Title I funds are federal funds provided to schools with high concentrations of low-income children enrolled. Only charter schools saw decreases in their Title I funds, with an average of $18,576 per school. Non-charter schools, on average, received increases in their Title I supplementary and discretionary funds to offset the reduction in SBB funds.