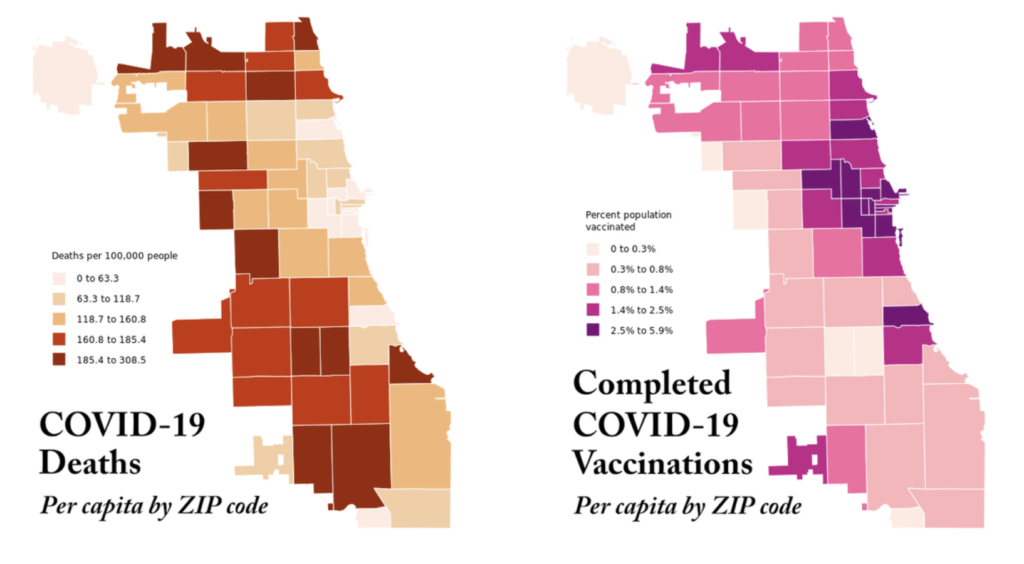
On Monday, January 25, the City of Chicago entered phase 1b of its vaccination plan. South Side Weekly’s open-source Twitter bot, created by Bea Malsky and Charmaine Runes, visualizes relative concentrations of COVID-19 deaths and fully vaccinated residents to date.
Our daily tracker pulls data directly from the Chicago Data Portal. The first map illustrates the number of COVID-19 deaths per 100,000 residents in each ZIP code, while the second map shows the percent of residents in each ZIP code who have received a complete dose of a COVID-19 vaccine, which currently means that they have received two doses of either the Pfizer or Moderna vaccine.
Note that this data represents where fully vaccinated Chicagoans live, not where they work or where they received the vaccine—so far suggesting a glaring disparity in both deaths and immunization along race and income.
Predominantly Black and Latinx ZIP codes continue to bear the brunt of COVID-19 fatalities, yet these communities have the lowest rates of complete vaccination in Chicago.
Chicago Department of Public Health Commissioner Dr. Allison Arwady acknowledged on Monday that the majority of Chicagoans who were vaccinated are white. City officials said they plan to address this by focusing on fifteen predominantly Black and Latinx neighborhoods where many essential workers reside and by improving upon its demographic data collection.
Chicago is currently reporting 32,438 people fully vaccinated: 1.2% of the population
— ChiVaxBot (@ChiVaxBot) January 26, 2021
Who is dying: Who is vaccinated: pic.twitter.com/5h3licN7F9
Both maps classify their respective data into five percentiles. We give each percentile a hue on a color scale—orange for deaths and pink for vaccines—to represent that range, where lighter hues mean lower values and darker hues mean higher values. One way to think about these percentiles is to imagine lining up every ZIP code in order of its particular data point, from lowest to highest, and then dividing the values into five groups such that every group represents an equal number of ZIP codes.
These maps do not tell the whole story of the city’s COVID-19 vaccine rollout, but we hope they encourage people to ask questions about who has access to vaccines and who ultimately receives them—and whether lack of access is a reflection of the phased rollout, community access to medical care, vaccine hesitancy, or Chicago’s systemic inequality and racism.
The bot will post updated maps every evening at https://twitter.com/ChiVaxBot.
You can sign up to receive vaccine updates from the Chicago Department of Health—including info on registration when it’s available—through the Chi COVID Coach.
If you have questions about the data or feedback on the bot, please feel free to reach out to us or write an issue in our GitHub repository.


My sister lives in 60659, is well over 70, and can’t find anyplace to get a vaccine. Walgreens none, Jewel Osco says next appointment October. Where are the vaccines??